How To Use The Debug Tool
Video
Article
If you are having issues with your pages, you can now use our debugger tool to debug which scripts, custom HTML elements or custom CSS is the root cause of the problem, meaning you won’t be relying on our support team to look into these things for you.
The debugger tool will allow you to deactivate your Custom Scripts, Custom CSS or Custom HTML Elements so that when you publish your page they no longer appear on your live page. This will allow you to find out whether it is your Custom Scripts, Custom CSS or Custom HTML elements that is causing the problem.
To use the debugger tool:
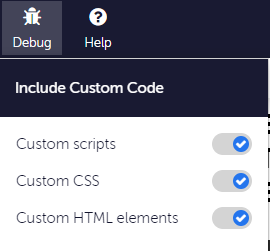
- In the Convertri editor, select the debug menu from the top toolbar.
- From the menu, choose which of the following you would like to toggle off from your pages: Custom Scripts, Custom CSS or Custom HTML Elements.
- Once you have decided which of these you would like to keep active on your page, you can then republish the page to see if any errors are still present on your page.
- If the error is still present, simply return to the editor and reactivate whichever elements you had previously deactivated, you can then deactivate any that you have not tested yet and republish the page to see if it has resolved the error.