Analytics Dashboard Overview
Video
Article:
How To Use Convertri’s Analytics Dashboard
Convertri’s analytics are a great way of tracking the success of your pages. There is so much you can do, from seeing which devices are being used to where the user was located. We have compiled this, and so much more, in one place for you with the analytics dashboard. To see this for a funnel, go to the Campaigns dashboard, select the funnel you want to see the Analytics for and you will see Analytics is an option on the left hand menu. Select this and you’ve arrived at the Dashboard.

The Different Functions of Convertri’s Analytics Dashboard
So you have reached the analytics dashboard. Now it’s time to dig a little deeper and see what all the different parts of the dashboard can do. The Source dropdown will let you navigate and see the analytics of each page without going to the pages. While the Date Range will give you control to display analytics data on the specific date in the overview and the default date range is one month.


Overview - This is where you can find the basic information for your funnel. You can see the Total number of Views and the Unique Views you had each day for the last month. Selecting Prospects changes so you are seeing the number of individual prospects your funnel had in the last month. Selecting Revenue allows you to see the amount of money this funnel has collected in the last month. To the side of these graphs is the total amount of views/prospects/revenue for this month, last month and the percentage change between the two.

Unique Views - You can click the Unique Views button so that all the statistics on the page reflect Unique Views. These are views by different users. Where total views will count a user twice if they entered the site twice, unique views will only count them once. Clicking this will change the view to Unique Views for all statistics shown in the dashboard.
Detailed Analytics - First up in this section is a Device Breakdown. This will tell you what percentage of your traffic comes from Desktop, Mobile, or Tablet. So for example if a lot of people are viewing your site on mobile, you know to optimize for this.
Breakdown by Location - Next to the Devices is a map which shows Breakdown by Location. You can see where the most views were in each part of the world by using the colour coded map. This is such a great insight for understanding if you have demand from countries you never even knew were viewing your site.

Page Performance - This provides a breakdown of how the individual pages in the funnel are performing. You can see the number of views they are getting as well as the percentage of conversions they are receiving. This helps to see which of your pages are really performing and which ones aren’t adding as much to your funnel.
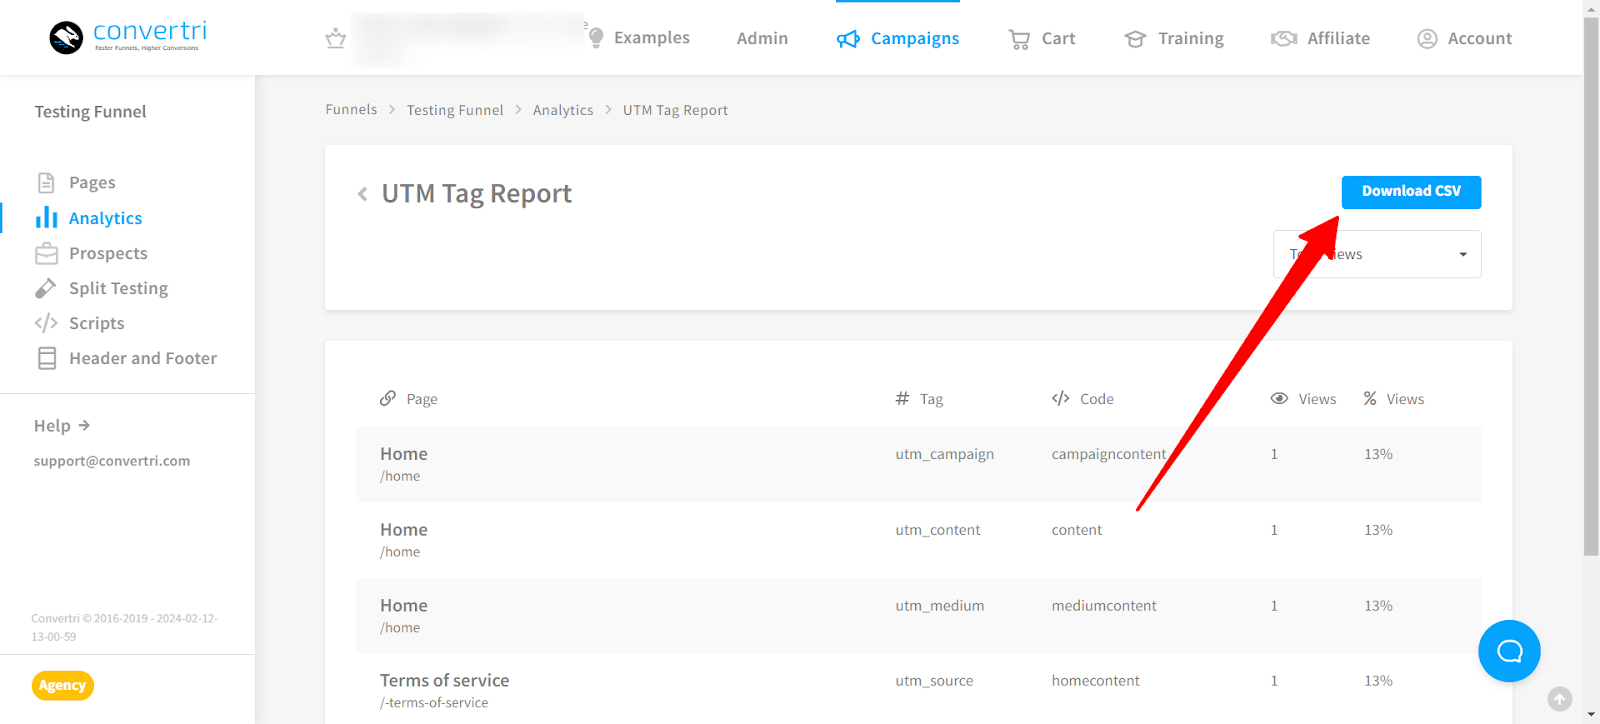
When you click 'View report,' utilize the filter option at the top right to exclusively display 'Unique Views.'
Sources - Sources are where your users have come from when they click on your link. The URL of the site which the user came from will show, as well as what percentage of views this site makes up. Just typing your URL into the search bar of a search engine won’t show the results here, it’s for showing when a user came from another site to yours. This allows you to see where advertising is working for you and where it isn’t.

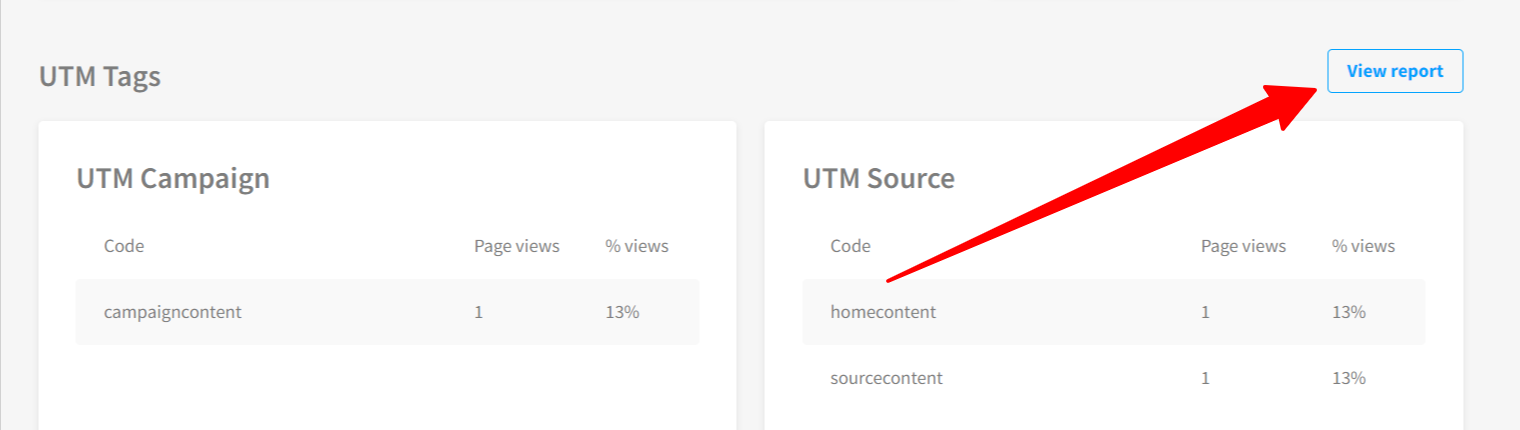
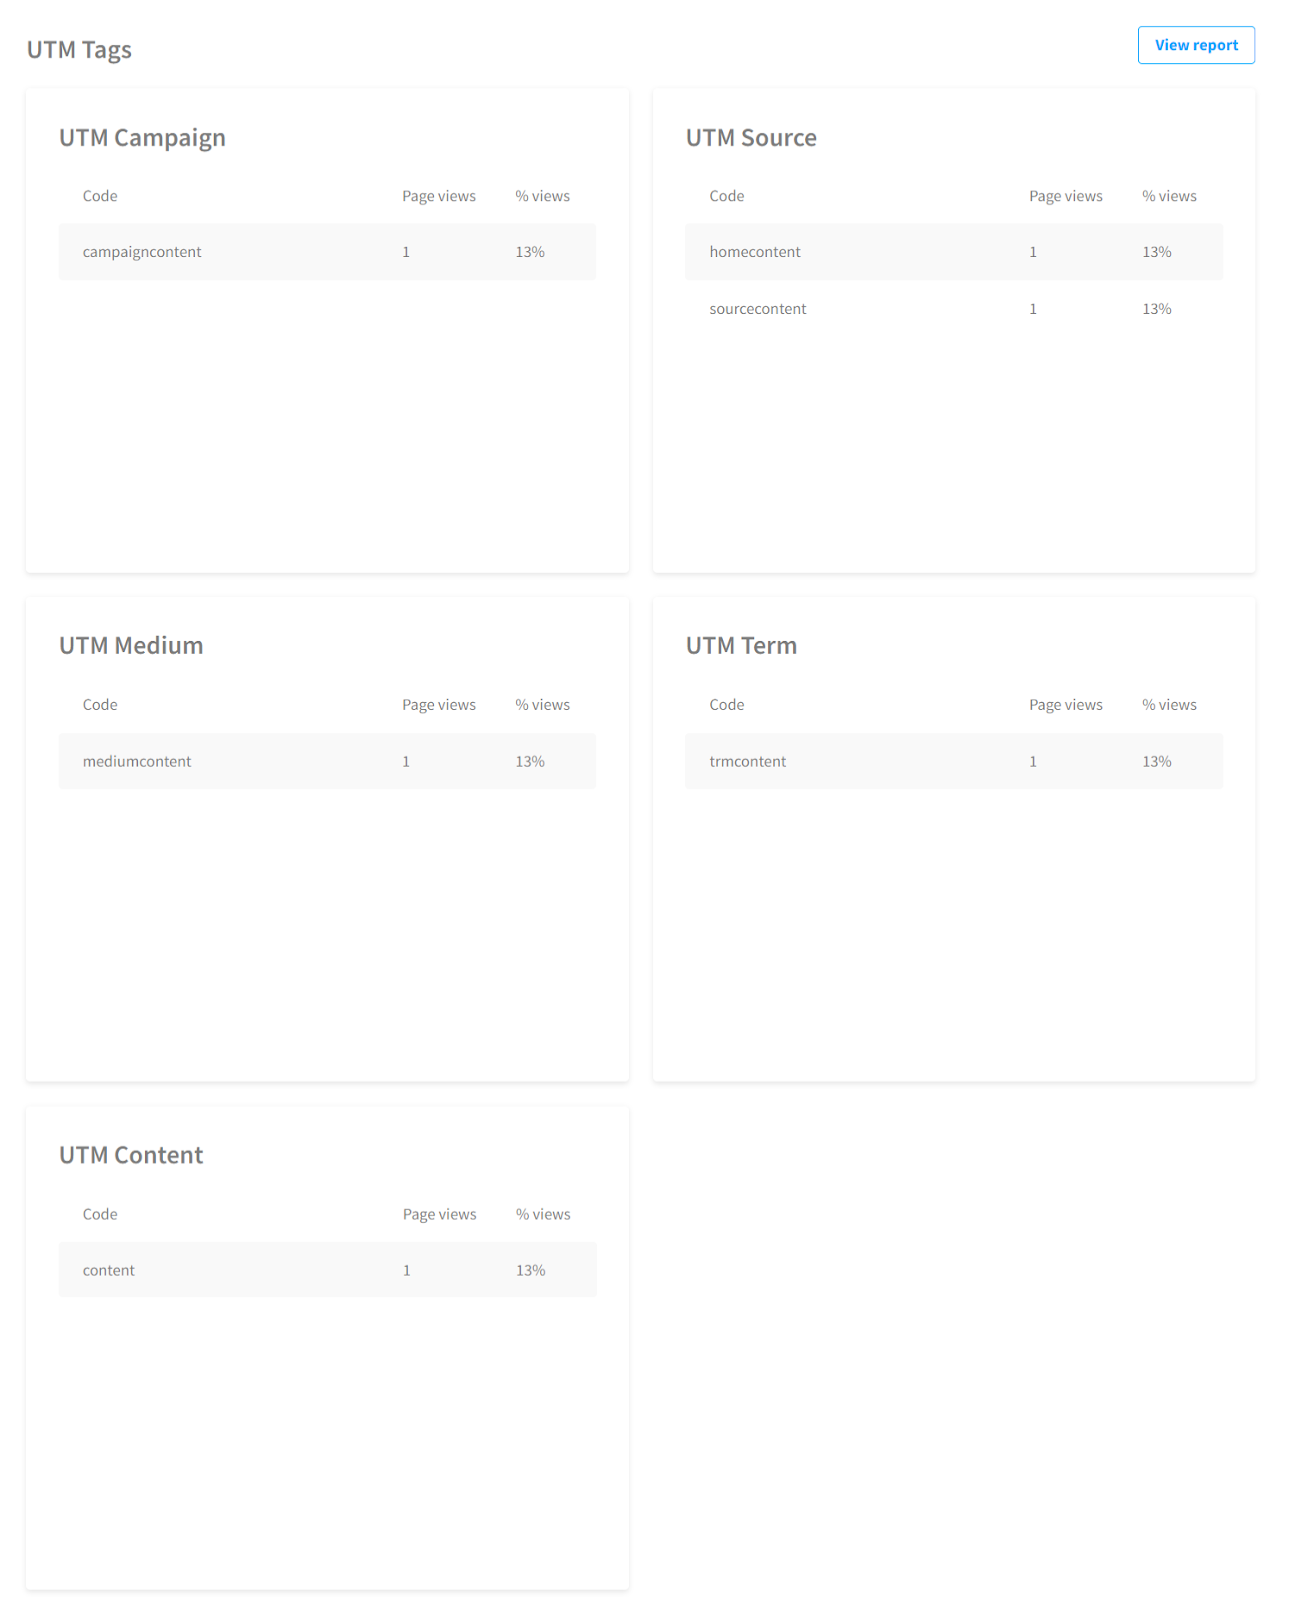
UTM Tags - Knowing at a glance which areas you’re getting your traffic from can be a valuable way of seeing which of your marketing campaigns are performing well or which sources you should concentrate more on. This allows you to see your tags you have used in your tracking URLs and how these different sources are performing. We track Campaign, Medium, Source, Term, and Content tags here and show you the top-performing parameters for these.
You can export and analyze UTM tag data. Simply click on the 'View Report' button corresponding to UTM tags to do so.
You can export the data into a CSV file by clicking on the 'Download CSV' option.